Dashboards
The workspace dashboard gives leadership a live, at-a-glance view of revenue, pipeline, events, and profitability.
The workspace dashboard
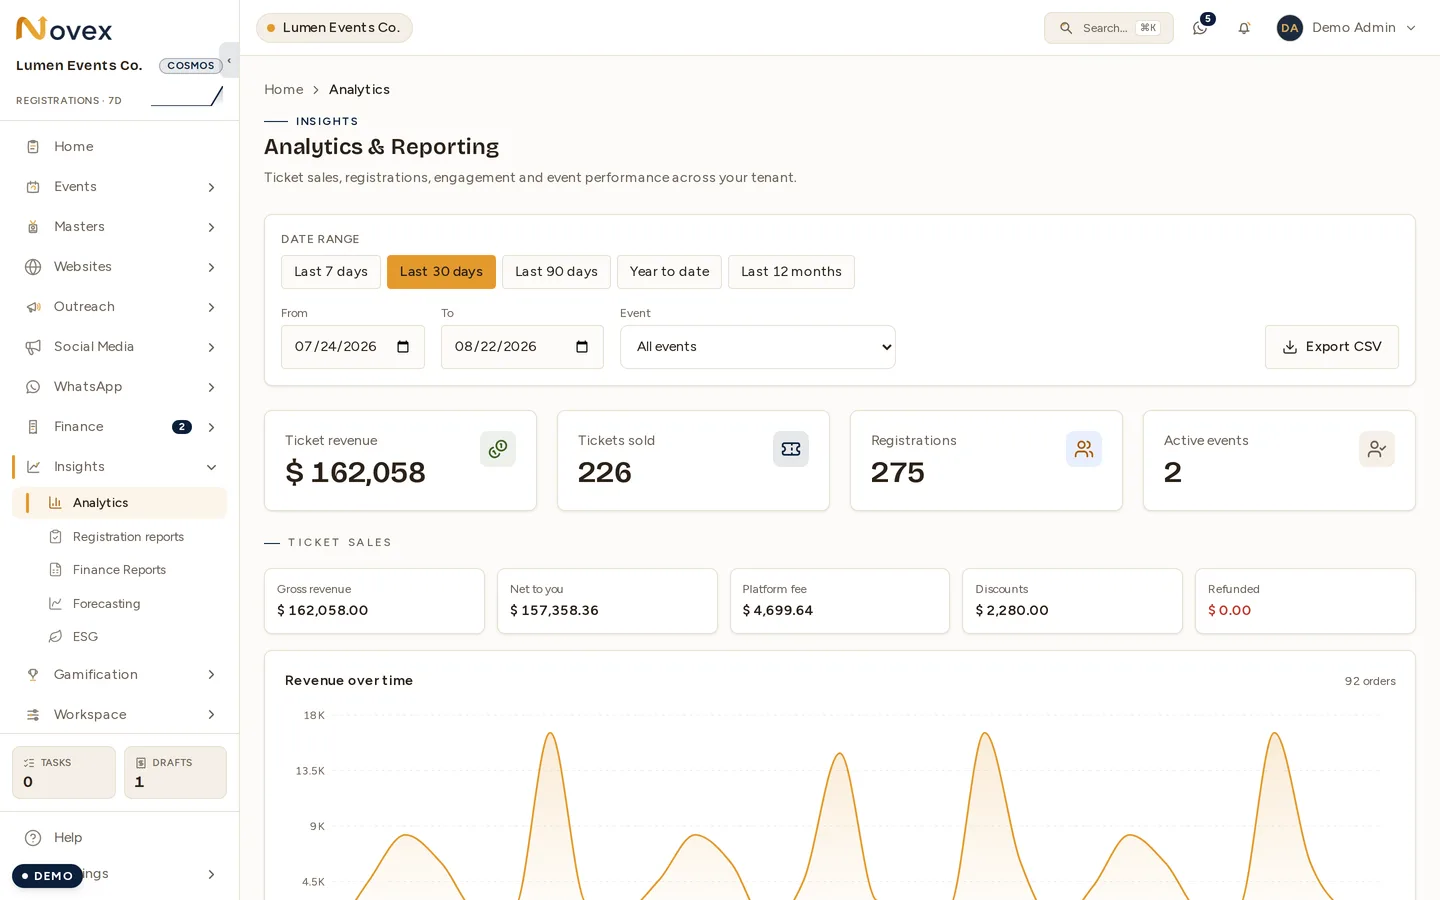
The workspace dashboard is the landing page after you sign in. It’s a grid of KPI tiles and charts covering:
- Revenue
- Sales pipeline value
- Active and upcoming events
- Registrations
- Leads
Tiles are role- and data-aware, so what you see reflects your access and your workspace’s data. Most tiles link through to the underlying records, so you can jump straight from a number to the events, deals, or invoices behind it.
Projected profit (this cycle)
A dashboard tile shows projected profit, calculated as:
Projected profit = quotation value (ex-VAT) − quoted project cost (ex-VAT)
It is a forward-looking figure: the revenue side is what you have quoted, not what you have invoiced or been paid, and the cost side is the cost lines on those same quotations.
Both sides are ex-VAT. If you try to reconcile this tile against VAT-inclusive totals it will not balance, and the tile is not the thing that is wrong.
It is not built from invoices. The realised figure — recorded payments ex-VAT minus project cost ex-VAT — is a separate number; do not read this tile as money received.
Where to go deeper
- The per-event operational view lives in the Command Center — the day-to-day cockpit for running a single event.
- Detailed slice-and-dice reporting lives in the Report pages, where you can filter by date range and event.
Permissions
- Viewing the dashboard requires being signed in to the workspace.
- Finance figures respect your finance read permissions, so projected profit and revenue tiles only show if you’re allowed to see finance data.